KOSPI fell 31% from its peak. It is still up 48% this year.
Korea's benchmark peaked at 9,114.55 on 22 June and closed at 6,257.45 on 3 August — down 31.3% in six weeks. But it ended 2025 at 4,214.17, so even after the drop it is up 48.5% year-to-date. Both are true at once. Not advice.
AI-assisted, human-reviewed sourcing. Figures are pulled programmatically from the official sources listed at the end of this article and checked by an editor before publication.
kospivolatilitykorean equitiesdrawdownmarket structure
Between 2021 and 2025, the KOSPI moved more than 3% in a day twenty times. Twenty days out of 1,225 — four a year, spread across five years.
In the first 143 trading days of 2026 it has done it fifty-three times.
The regime, in one column
| Year | Average daily move | Largest | Days above 3% |
|---|---|---|---|
| 2020 | 1.22% | 8.60% | 19 of 248 |
| 2021 | 0.79% | 3.97% | 3 of 248 |
| 2022 | 0.93% | 3.52% | 4 of 246 |
| 2023 | 0.73% | 5.66% | 1 of 245 |
| 2024 | 0.88% | 8.77% | 4 of 244 |
| 2025 | 1.00% | 6.60% | 8 of 242 |
| 2026 (to 3 Aug) | 2.99% | 17.91% | 53 of 143 |
The average day in 2026 is three times the average day in 2023. This is not a market that fell; it is a market that changed how it moves.
July was the sharp end of it: 22 sessions, an average absolute move of 4.89%, and ten days above 5%. The worst was −10.84% on 28 July. The best was +17.91% on 31 July — the largest single-day gain anywhere in this six-and-a-half-year file.
The drawdown, and the number that complicates it
The index peaked at 9,114.55 on 22 June and closed at 6,257.45 on 3 August: down 31.3% in six weeks.
It is broad. Four indices built from different constituent lists tell the same story:
| Index | 22 Jun | 3 Aug | Change |
|---|---|---|---|
| KOSPI | 9,114.55 | 6,257.45 | −31.3% |
| KOSPI 200 | 1,477.22 | 986.72 | −33.2% |
| KRX 100 | 23,510.06 | 15,628.90 | −33.5% |
| KOSDAQ | 968.40 | 737.35 | −23.9% |
Listed market capitalisation on the KOSPI went from 7,450tn won to 5,165tn — 2,285tn won gone in six weeks.
And here is the number that stops the obvious headline. The KOSPI closed 2025 at 4,214.17. At 6,257.45 it is up 48.5% on the year.
Both things are true at once. An investor who bought in January is well ahead. An investor who bought in June is down a third. The index went up 116% from the end of 2024 to 22 June and then gave back a third of it, and the year-to-date figure — the one that appears in most summaries — hides the entire round trip.
What we are not saying
We do not know why. This feed carries closes, ranges, turnover and market capitalisation; it does not carry a reason, and we are not going to invent one from a price series. Anyone offering a confident explanation is working from something other than this data.
We also cannot tell you whether the index is cheap now. That needs earnings, which are not in this dataset.
What the data does support is narrower and, we think, more useful: the thing that changed in 2026 is not the level, it is the variance. A market whose average day is 3% prices risk differently from one whose average day is 0.8%. Hedging costs more. Stop-losses trigger. Position sizes that were prudent in 2023 are not prudent now, and that is true whether the index goes up from here or down.
One methodological note, because it nearly caught us
The exchange publishes 168 index series a day, and the name alone is not a unique key. “IT services” exists in both the KOSPI and KOSDAQ series — 1,159.33 and 607.25 respectively on 3 August, with 25 and 227 constituents. So do “construction”, “metals”, “finance” and “machinery”. Group by name and two different indices merge into one line, silently, with no error.
Seven of the 168 are calculated indices — the K-Sharpe series and similar — which report zero volume and zero market capitalisation by design. A zero there means “this is not a traded index”, not “nothing traded today”. Every figure above is keyed on series plus name, and calculated indices are excluded from turnover figures.
Data & Verification Notes
- Data as of
- Sources
- Financial Services Commission (Korea) — Market Index Information Open API — getStockMarketIndex (daily close, change, turnover and listed market capitalisation by index)
- Cross-checks
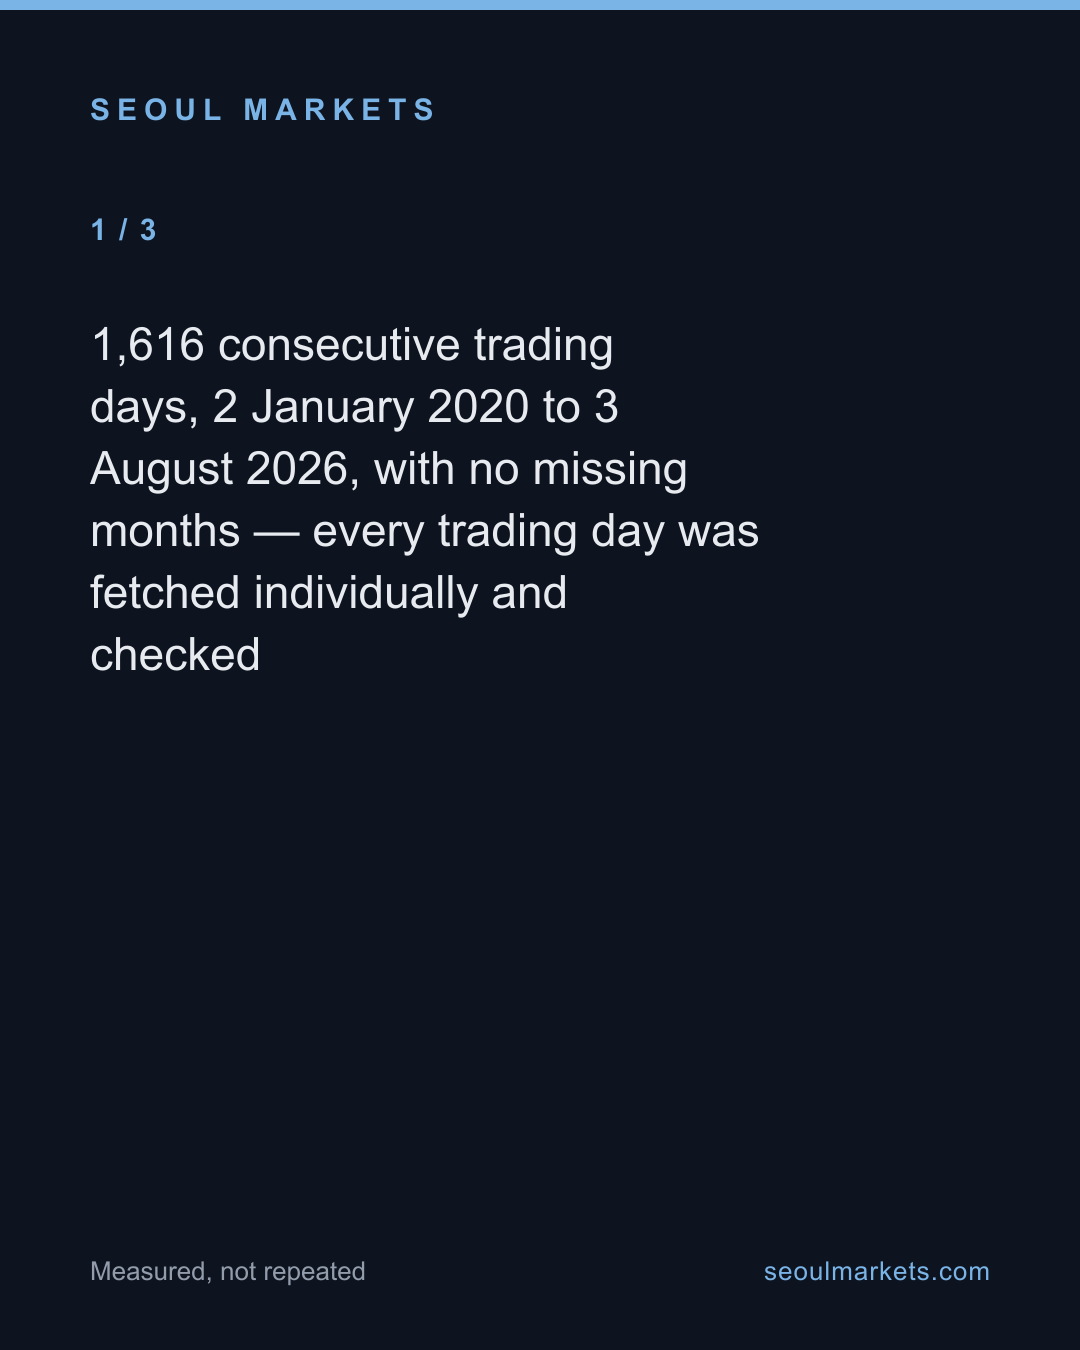
- 1,616 consecutive trading days, 2 January 2020 to 3 August 2026, with no missing months — every trading day was fetched individually and checked
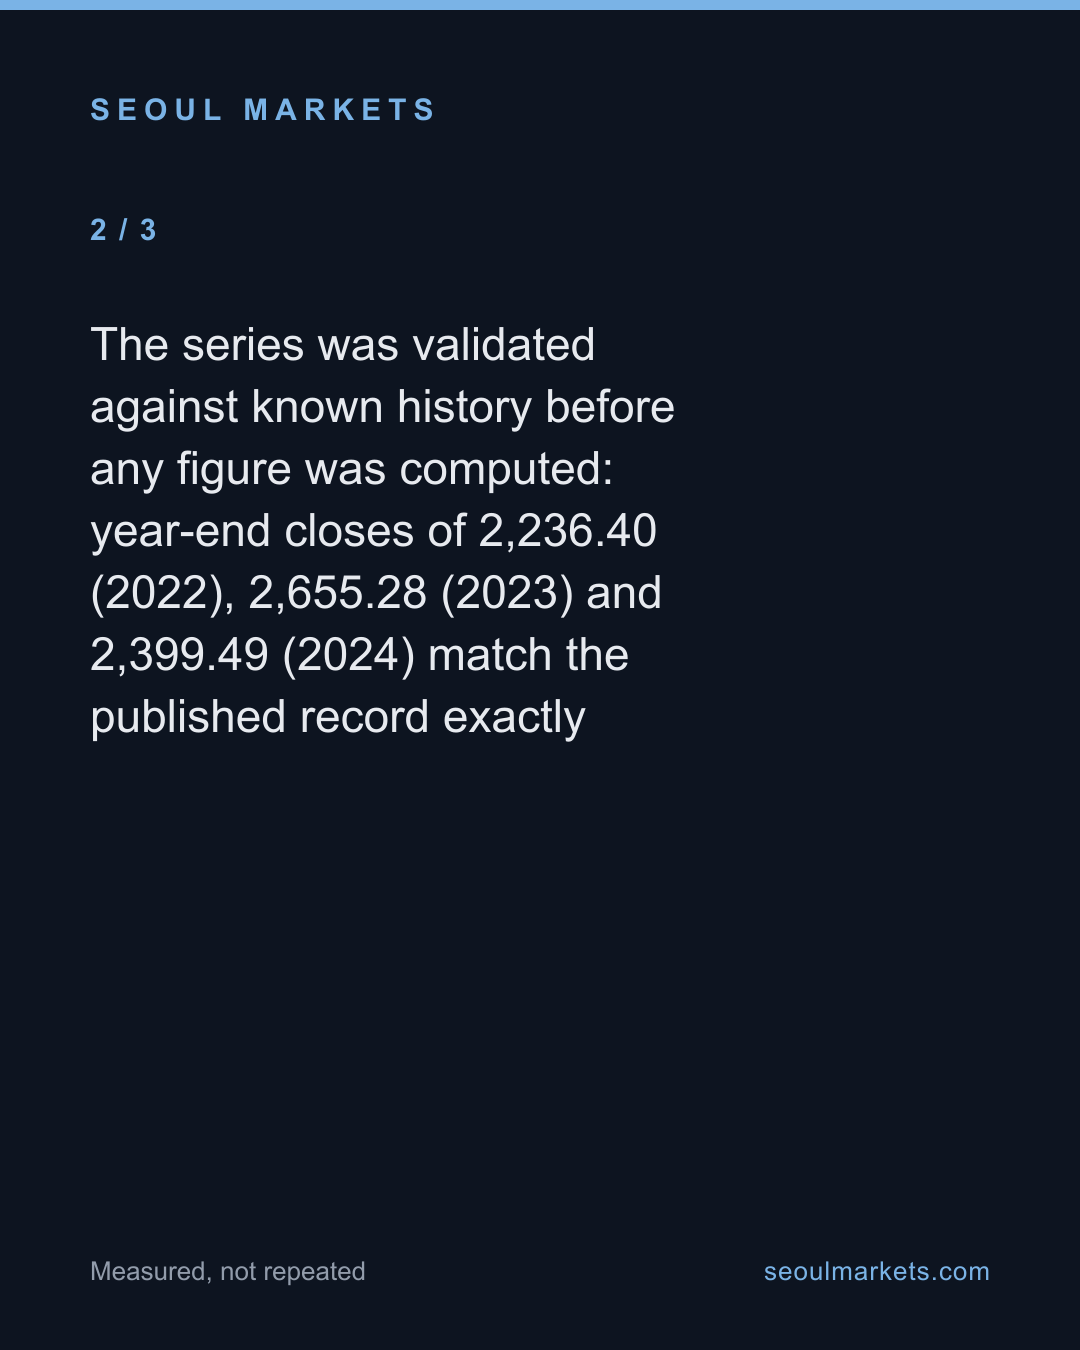
- The series was validated against known history before any figure was computed: year-end closes of 2,236.40 (2022), 2,655.28 (2023) and 2,399.49 (2024) match the published record exactly
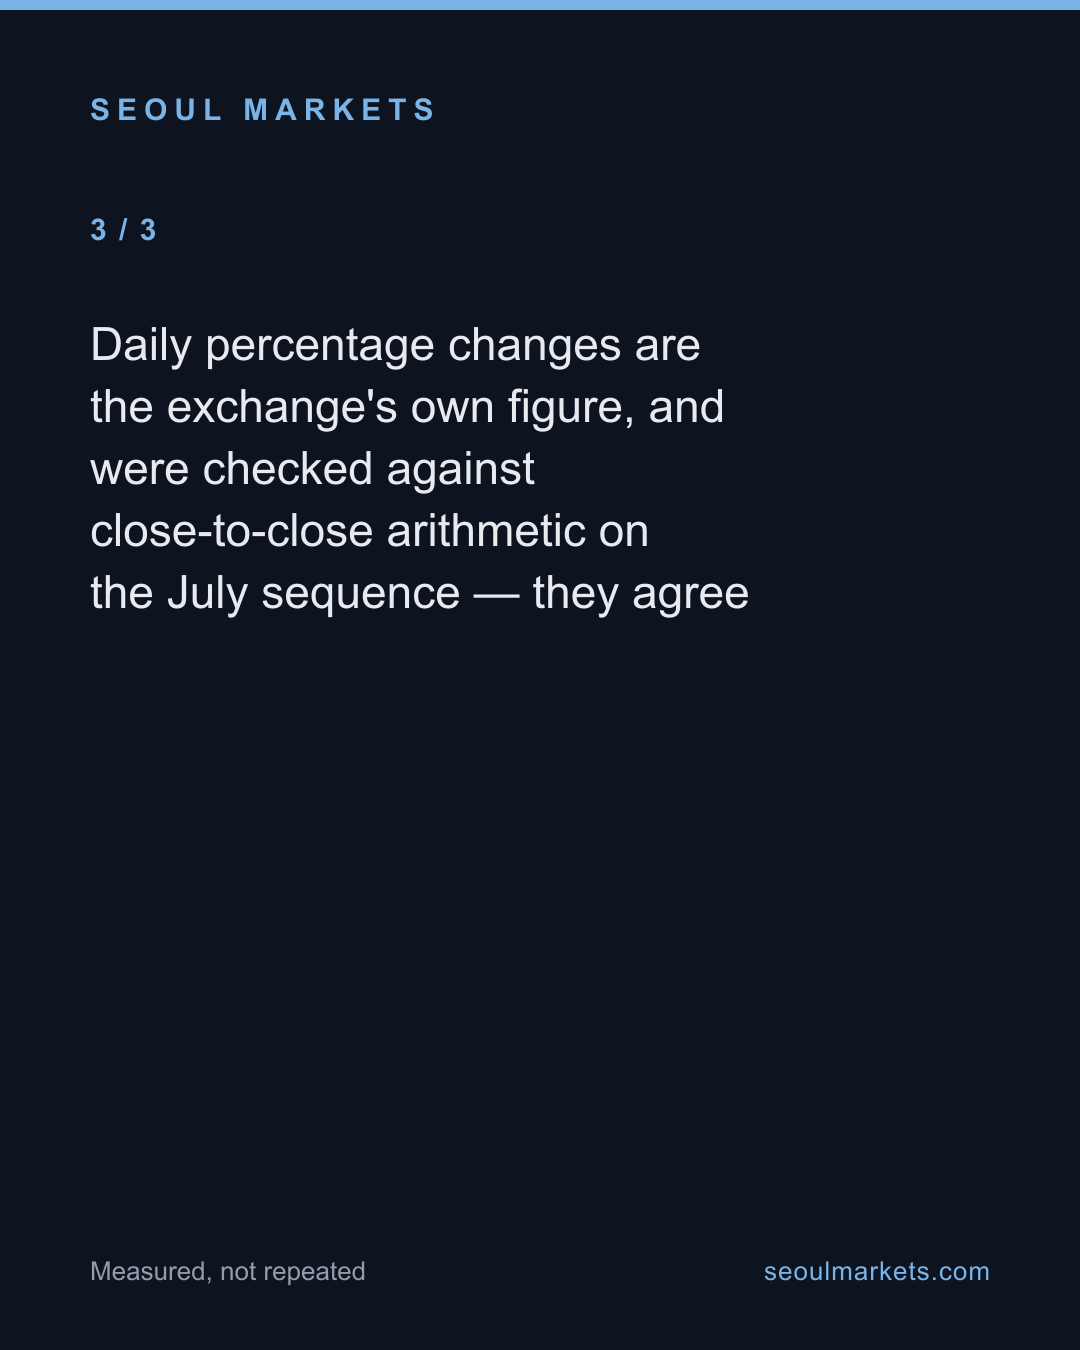
- Daily percentage changes are the exchange's own figure, and were checked against close-to-close arithmetic on the July sequence — they agree
- The move is confirmed on four separate indices computed from different constituent sets, so it is not an artefact of one index's construction
- An index name is not a unique key: 'IT services', 'construction', 'metals', 'finance' and others exist in both the KOSPI and KOSDAQ series with different values. Every series here is keyed on series plus name
- Excluded figures
- Why any of this happened. The feed carries prices, not causes, and we are not going to supply one
- Whether the index is now cheap, expensive, or anything else. That needs earnings, which are not in this dataset
- Intraday behaviour. These are daily open, high, low and close figures; what happened between them is not recorded here
- Foreign versus domestic flows, which this feed does not carry
- Any comparison to other countries' indices — we have not collected them and will not eyeball them
The full dataset behind these figures — every listed company, every row — is available to license. SeoulMarkets data for licence →
Not investment advice. SMarkets publishes data journalism for general information only. Nothing here is investment advice, a recommendation, or an offer to buy or sell any security — any investment you make is at your own risk and responsibility. Figures are derived from official public data sources and may be revised by the issuing agency. Verify independently before acting.
Take this away — 5 cards
The figures in this article, as images. Free to repost with the address on them.