Korean firms with more women underperformed by 17 points last year. Control for industry and the gap vanishes.
Across 2,573 listed companies, staff tenure and female share both look like they predict returns — in opposite directions. They are the same fact counted twice. One survives an industry control; the other does not.
AI-assisted, human-reviewed sourcing. Figures are pulled programmatically from the official sources listed at the end of this article and checked by an editor before publication.
workforceemployee tenuregenderkorean equitiesindustry effects
Every listed Korean company files the same workforce table once a year: how many people it employs, how long they stay, and what they are paid, split by sex. Set that table against what the share price then did, and a striking pair of numbers falls out.
Sort 2,573 companies into five groups by average staff tenure:
| Tenure group | Median tenure | Median 12-month return | Median female share |
|---|---|---|---|
| Shortest fifth | 2.9 yr | −26.2% | 36.6% |
| 4.6 yr | −21.9% | 29.6% | |
| 6.3 yr | −10.8% | 24.2% | |
| 8.4 yr | −11.9% | 20.2% | |
| Longest fifth | 13.0 yr | −9.2% | 13.8% |
The return column moves in one direction across all five groups — a spread of 17.0 percentage points. So does the female-share column, in the opposite direction.
Read carelessly, that second column is a headline: companies employing more women returned 17 points less. It would be wrong.
The two columns are one fact
Tenure and female share are correlated at −0.384 across these companies. Industries that keep staff for a decade — shipbuilding, chemicals, heavy machinery — employ few women. Industries that turn staff over in three years — retail, food service, cosmetics — employ many.
The quintile table is not showing two findings. It is showing one industry map, twice.
What survives when industry is held constant
Compare each company against its own industry’s median rather than against the whole market. Across the 38 industries with at least 12 listed companies — 2,430 firms in total:
| Rank correlation with return | |
|---|---|
| Staff tenure | +0.134 |
| Female share | −0.037 |
The female-share relationship collapses to approximately nothing. It was industry composition, and once industry is held constant it stops describing anything.
The tenure relationship survives. It is weak — 0.134 is a tendency, not a rule — but it does not disappear the way the other one does.
And it is a floor, not a ladder
The surviving effect is not “longer is better”. Grouped by distance from each company’s own industry median:
| Tenure vs industry median | Median return |
|---|---|
| 3.4 years below | −9.3 pp vs industry |
| 1.5 years below | −3.6 pp |
| At the median | +1.3 pp |
| 1.7 years above | +0.7 pp |
| 5.2 years above | +3.0 pp |
The penalty is concentrated at the bottom. Once a company reaches its industry’s normal tenure, having more of it adds almost nothing.
The cut-off is also insensitive to where it is drawn:
| Companies below their industry median by | Count | Median return | Everyone else |
|---|---|---|---|
| 1 year or more | 901 (37%) | −18.4% | −12.3% |
| 2 years or more | 602 (25%) | −18.4% | −12.9% |
| 3 years or more | 326 (13%) | −18.4% | −13.4% |
Being a year below the industry norm is associated with the same −18.4% as being three years below. What matters is being below it, not how far.
Where it holds and where it does not
Of the 38 industries, 27 show the longer-tenure half outperforming and 11 show the reverse.
| Strongest | Weakest | ||
|---|---|---|---|
| Professional services (29) | +50.7 pp | Education (12) | −19.0 pp |
| Insurance and pensions (12) | +41.7 pp | Non-metallic minerals (34) | −13.9 pp |
| Building construction (41) | +27.6 pp | Other technical services (18) | −12.7 pp |
| Electrical equipment (93) | +26.2 pp |
Seventy-one percent is a majority, not a law. Anyone using this on a single company is using it outside what it can support.
The context these numbers sit in
The median company in this sample lost 14.3% over the twelve months, and only 33.5% rose at all. Every figure above is a comparison between kinds of decline, not a search for winners.
We are also not claiming direction. A company whose staff stay may be a company whose business is stable — in which case tenure is a symptom, and the share price is responding to the business, not to the tenure. This dataset cannot separate those, and we are not going to pretend otherwise.
What it can do is settle the first question. The gap that looked like it was about who companies employ was about what business they are in. The one that was left is smaller, duller, and harder to write a headline about — which is usually the sign that it is the real one.
Data & Verification Notes
- Data as of
- Sources
- Financial Supervisory Service (Korea) — DART — empSttus — annual workforce disclosure filed by every listed company: headcount, average tenure and average pay, split by sex
- Financial Services Commission (Korea) — Stock Price Information Open API — getStockPriceInfo (daily close, listed shares and market capitalisation for every listed Korean company)
- Cross-checks
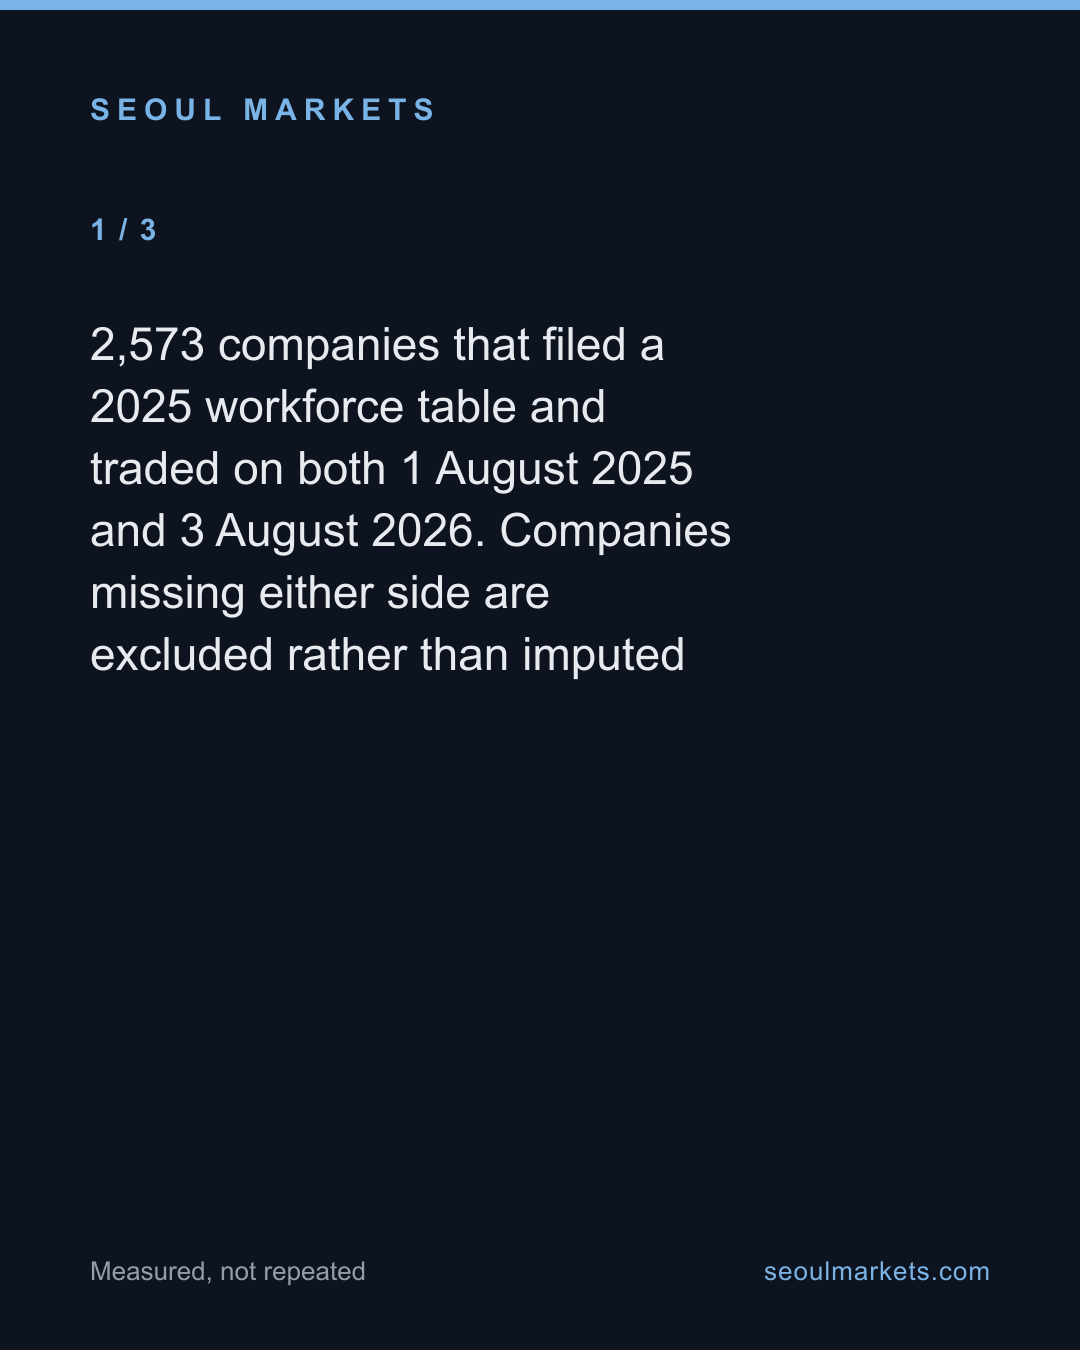
- 2,573 companies that filed a 2025 workforce table and traded on both 1 August 2025 and 3 August 2026. Companies missing either side are excluded rather than imputed
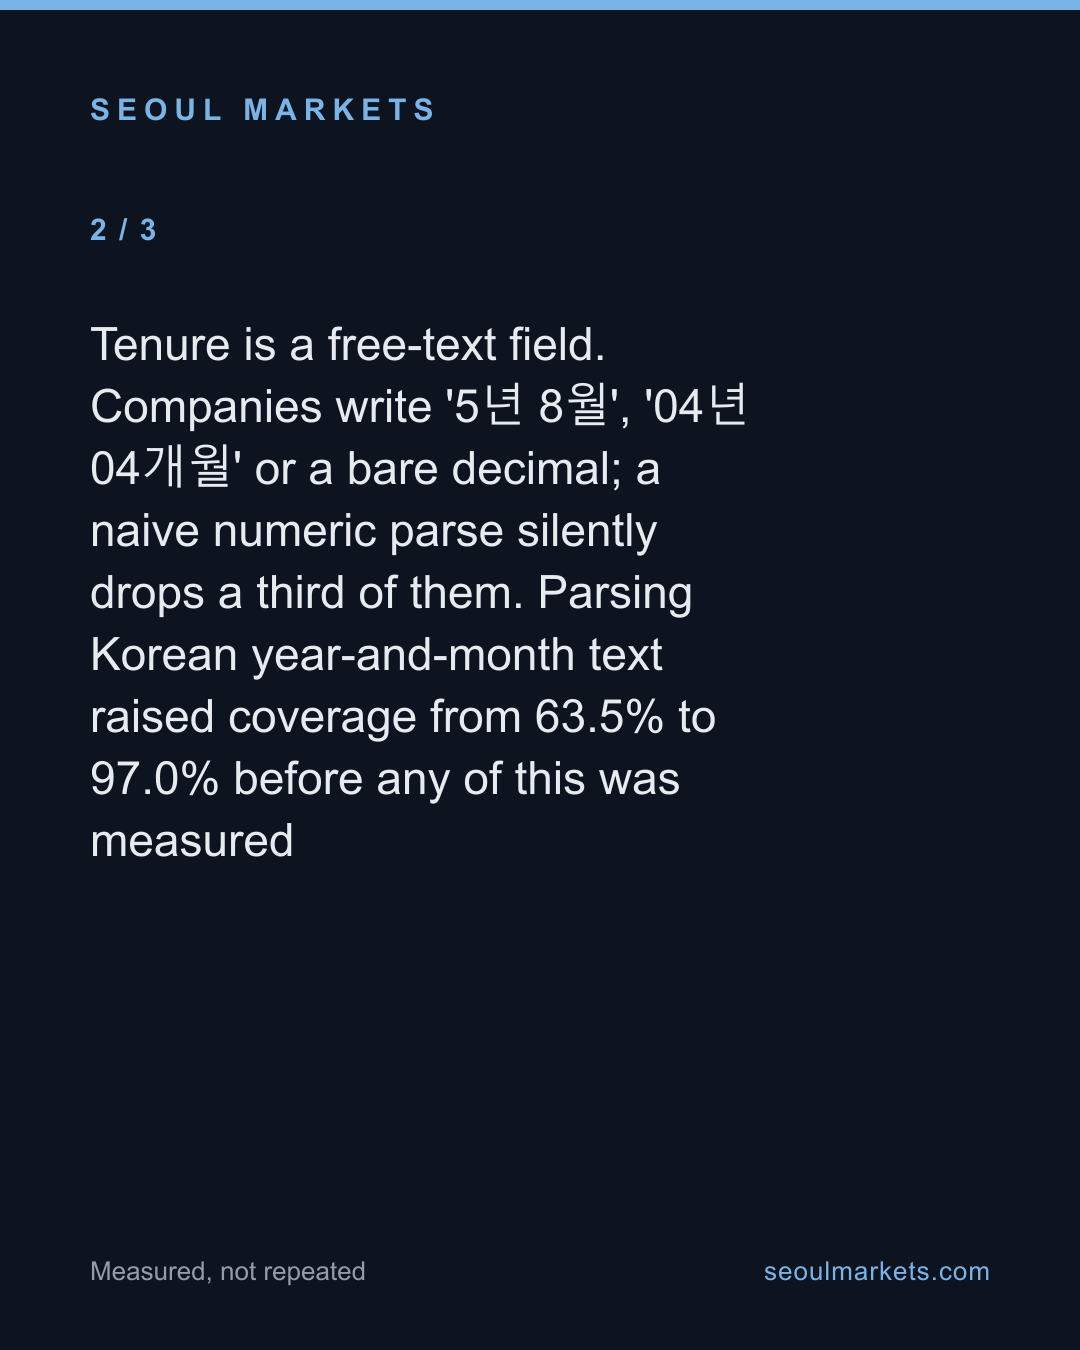
- Tenure is a free-text field. Companies write '5년 8월', '04년 04개월' or a bare decimal; a naive numeric parse silently drops a third of them. Parsing Korean year-and-month text raised coverage from 63.5% to 97.0% before any of this was measured
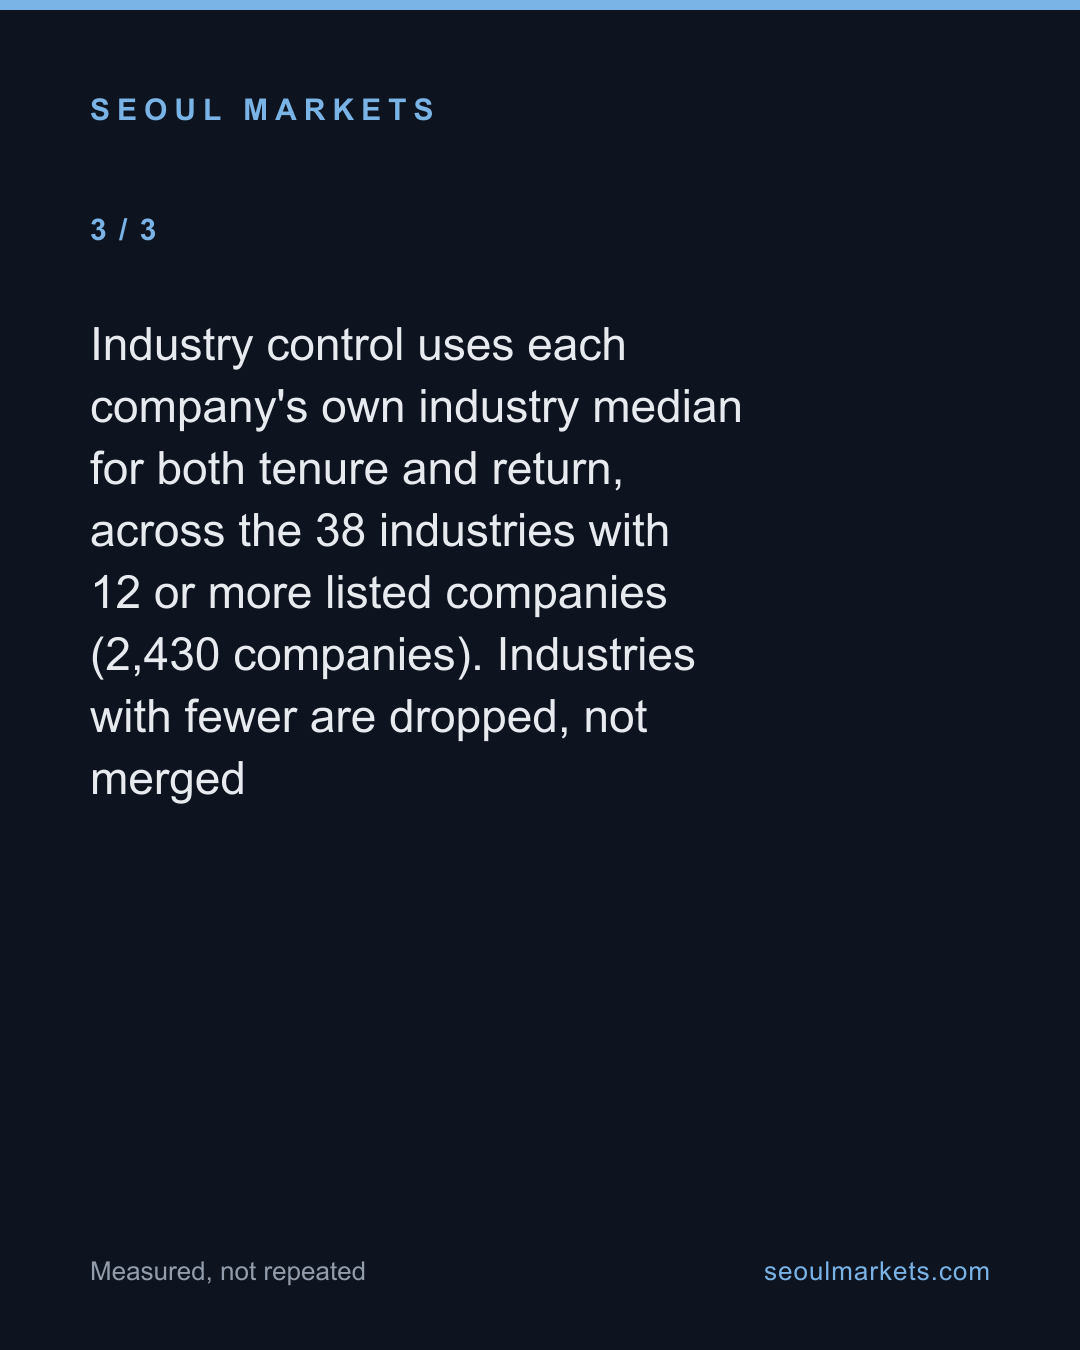
- Industry control uses each company's own industry median for both tenure and return, across the 38 industries with 12 or more listed companies (2,430 companies). Industries with fewer are dropped, not merged
- Spearman rank correlation is used throughout rather than Pearson, so a handful of extreme movers cannot create the relationship
- The tenure-female correlation was computed directly (−0.384) rather than inferred from the quintile tables
- Returns are price returns from close to close. Dividends are not included, which understates total return for higher-yielding sectors
- Excluded figures
- Any causal claim. Long tenure may be a symptom of a stable business rather than a cause of anything, and this data cannot separate the two
- Whether the pattern repeats in other periods. This is one 12-month window in a falling market — the median company lost 14.3%
- Company-level recommendations. A rank correlation of 0.134 describes a tendency across thousands of firms, not a property of any one of them
- Pay and headcount as predictors. Both were measured and neither produced a monotonic relationship worth reporting
- Non-listed employers, and any company that did not file the workforce table
- Corrections
- — Headcount for companies that file their employee table split by business division was understating the total: only the first division was counted. 986 of 2,921 companies were affected, which moves female share (women as a share of headcount) and the headcount-weighted tenure figures. Every correlation was recomputed: tenure against female share from −0.373 to −0.384, and after the industry control, tenure against return from +0.127 to +0.134 and female share against return from −0.061 to −0.037. The conclusion is unchanged and slightly stronger — the female-share relationship collapses further once industry is controlled for.
- — The headline said 14 points. The spread across the five tenure groups is 17.0 percentage points on the corrected data; the article body has been updated to match and the headline corrected with it.
The full dataset behind these figures — every listed company, every row — is available to license. SeoulMarkets data for licence →
Not investment advice. SMarkets publishes data journalism for general information only. Nothing here is investment advice, a recommendation, or an offer to buy or sell any security — any investment you make is at your own risk and responsibility. Figures are derived from official public data sources and may be revised by the issuing agency. Verify independently before acting.
Take this away — 5 cards
The figures in this article, as images. Free to repost with the address on them.