Market value per employee ranges 3,100-fold across Korean firms. Almost all of it is an artifact.
Divide a company's market cap by its staff and the spread is absurd — 3,100 times. Remove the holding companies and pre-revenue biotech, and what survives is a 17-fold gap between industries: capital intensity, not what anyone produced.
AI-assisted, human-reviewed sourcing. Figures are pulled programmatically from the official sources listed at the end of this article and checked by an editor before publication.
market capemployeescapital intensityvaluationkorea
Take every listed Korean company, divide its stock-market value by the number of people it employs, and the range is ridiculous: from top to bottom, a factor of about 3,100. Read literally, the market values one company’s worker three thousand times another’s. It does not, and the number is worth walking through precisely because it is wrong.
Why the company number means nothing
The top of that list is not a factory or a lab. It is a holding company — a corporate shell that owns operating subsidiaries, carries the market value of the whole group, and employs a few dozen people at head office. Divide a group’s market cap by a head-office roster and you get a vast number that describes an accounting boundary, not a workplace.
Remove the financial sector, where those structures cluster, and the 3,100-fold spread collapses to 204. What is left at the top is the other distortion: pre-revenue biotech, a dozen or two scientists sitting under a market cap that is entirely a wager on a drug that does not exist yet. Neither case is a fact about workers. Both are facts about where headcount gets booked.
So the company ranking goes in the bin. It is the kind of number that looks like insight and is really a seam in the data.
What survives: the industry median
Medians do not care about a long tail. Take the middle company in each industry — using only the 26 industries with at least 20 listed operating companies, financials and holding shells removed — and the spread falls to a sober 17.5 times, top to bottom.
| Industry | Median market cap per employee | Firms (n) |
|---|---|---|
| Financial support services | ₩4.0bn | 47 |
| Research and development | ₩2.0bn | 76 |
| Other transport equipment | ₩1.4bn | 29 |
| Wholesale trade | ₩0.78bn | 114 |
| Electrical equipment | ₩0.78bn | 94 |
| Electronics and telecom equipment | ₩0.64bn | 299 |
| … | ||
| Food products | ₩0.29bn | 74 |
| Apparel | ₩0.28bn | 30 |
| Motor vehicles | ₩0.26bn | 105 |
| Computer programming | ₩0.25bn | 37 |
| Pulp and paper | ₩0.23bn | 22 |
What it does and does not say
This is a map of capital intensity, and only that. At the top sit industries where a lot of market value rests on few people — asset-management support firms, and the research houses whose worth is a pipeline rather than a payroll. At the bottom sit the people-heavy trades: carmaking, software, apparel, food, paper. Even Korea’s famous chip sector lands mid-table, because its market value, large as it is, is spread across a large workforce.
It is tempting to read the top of this list as the most productive and the bottom as the least. That reading is wrong, and worth resisting. Market capitalisation is what investors are betting a company will be worth, not what its staff produced this year; a software house near the bottom may earn more per head than a biotech near the top. The number measures how thinly the market’s bet is spread over people — a real and rarely-published cut, and nothing more than that.
Data & Verification Notes
- Data as of
- Sources
- Financial Supervisory Service (DART) and Korea Exchange — Headcount from DART annual-report disclosures joined to KRX market capitalisation by ticker
- Cross-checks
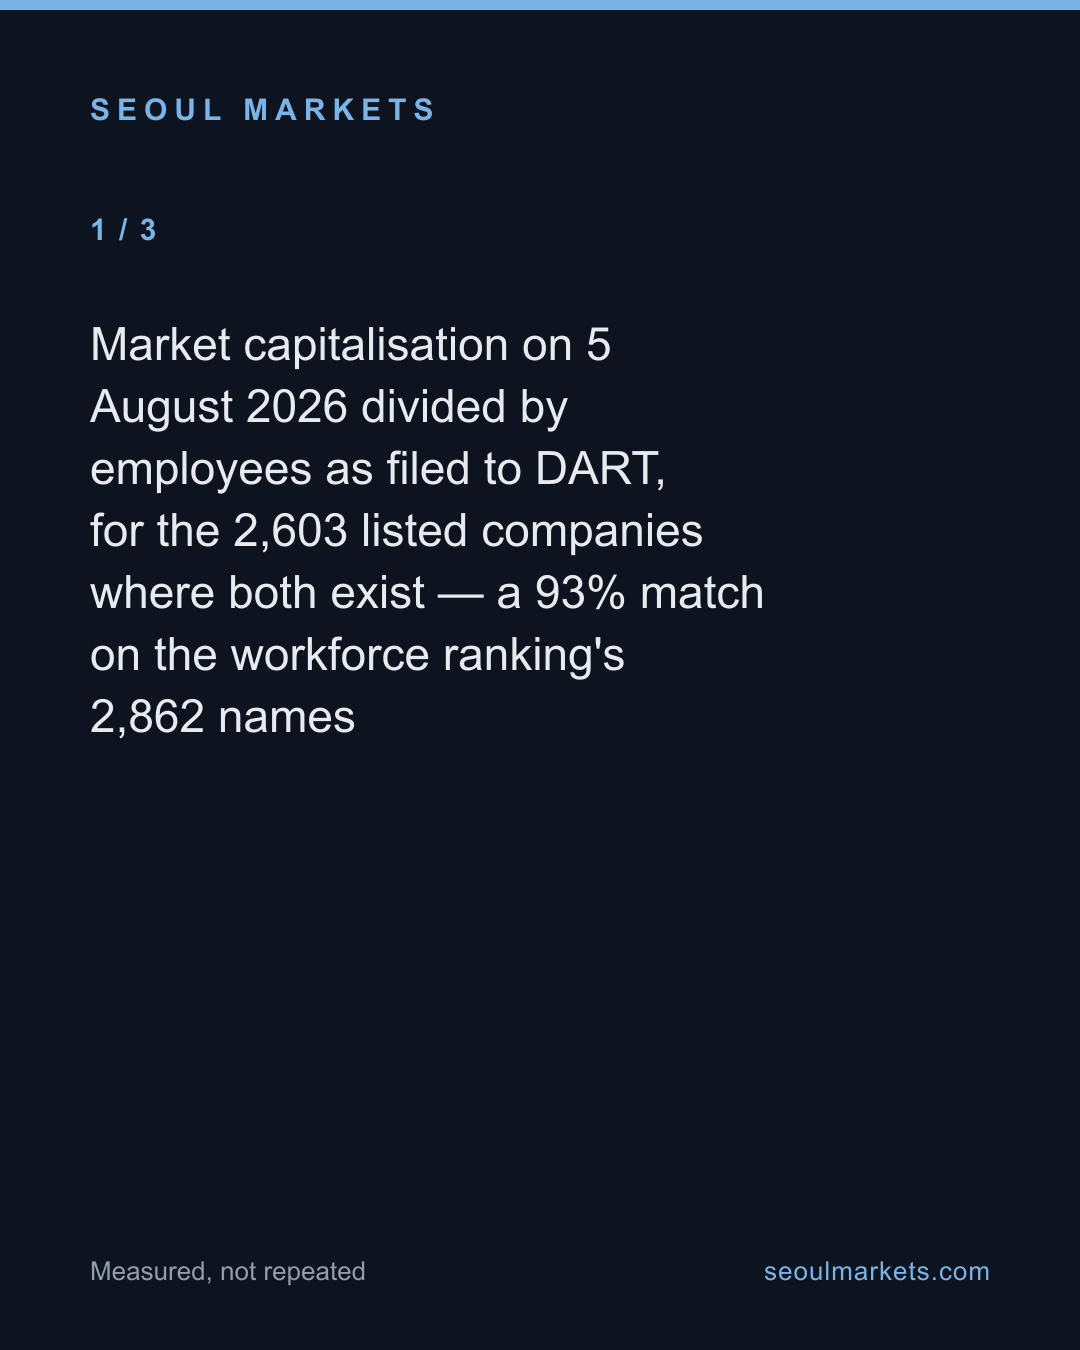
- Market capitalisation on 5 August 2026 divided by employees as filed to DART, for the 2,603 listed companies where both exist — a 93% match on the workforce ranking's 2,862 names
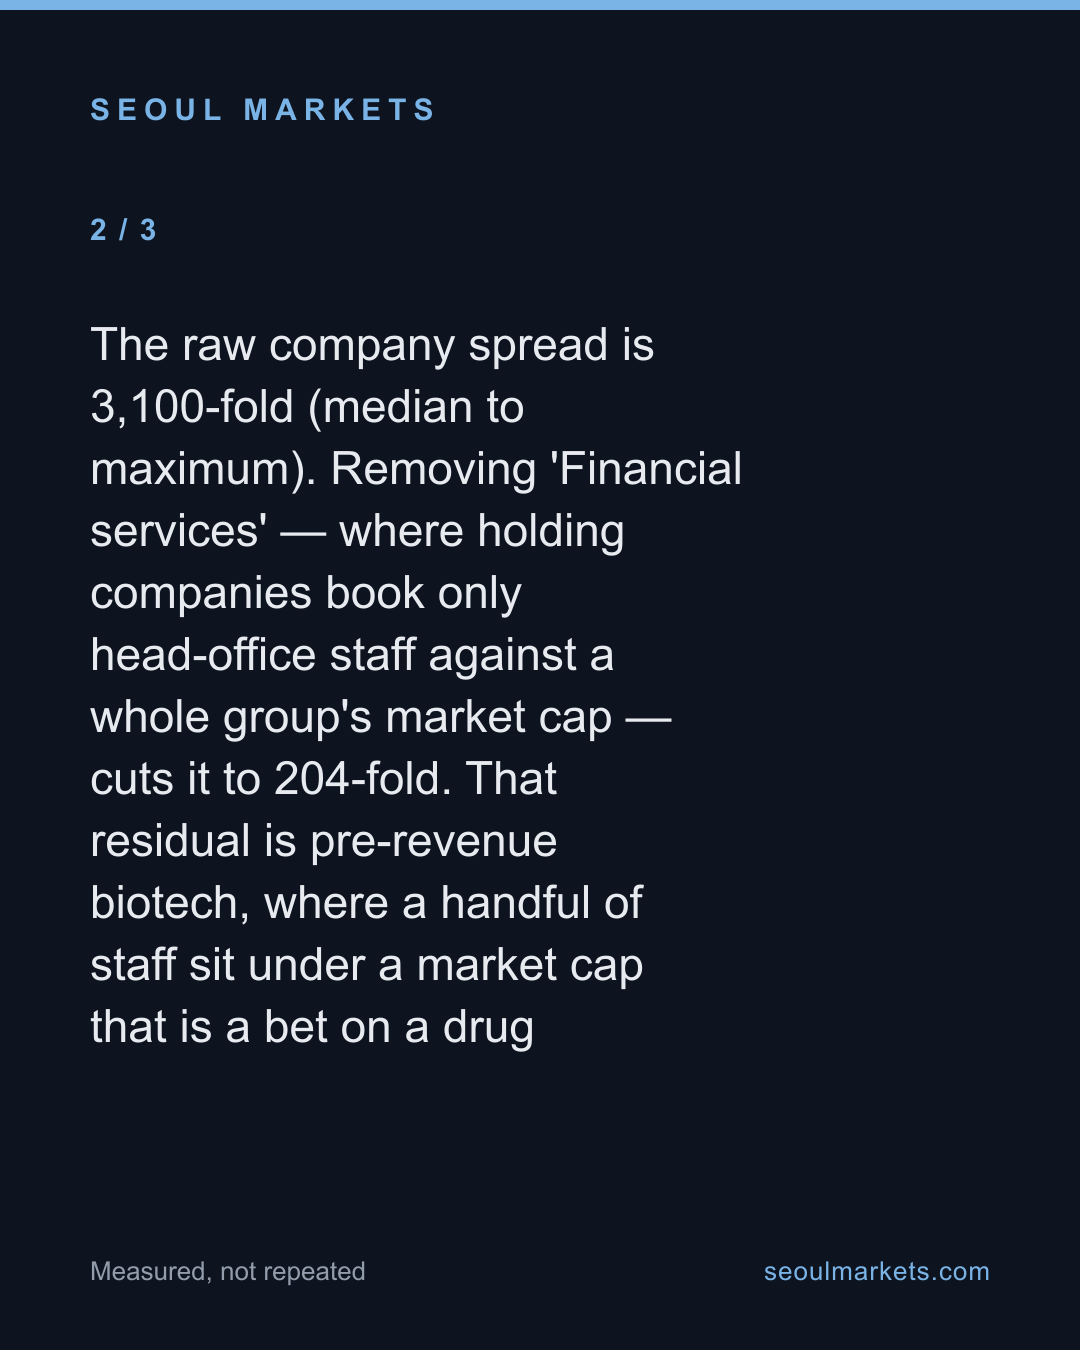
- The raw company spread is 3,100-fold (median to maximum). Removing 'Financial services' — where holding companies book only head-office staff against a whole group's market cap — cuts it to 204-fold. That residual is pre-revenue biotech, where a handful of staff sit under a market cap that is a bet on a drug
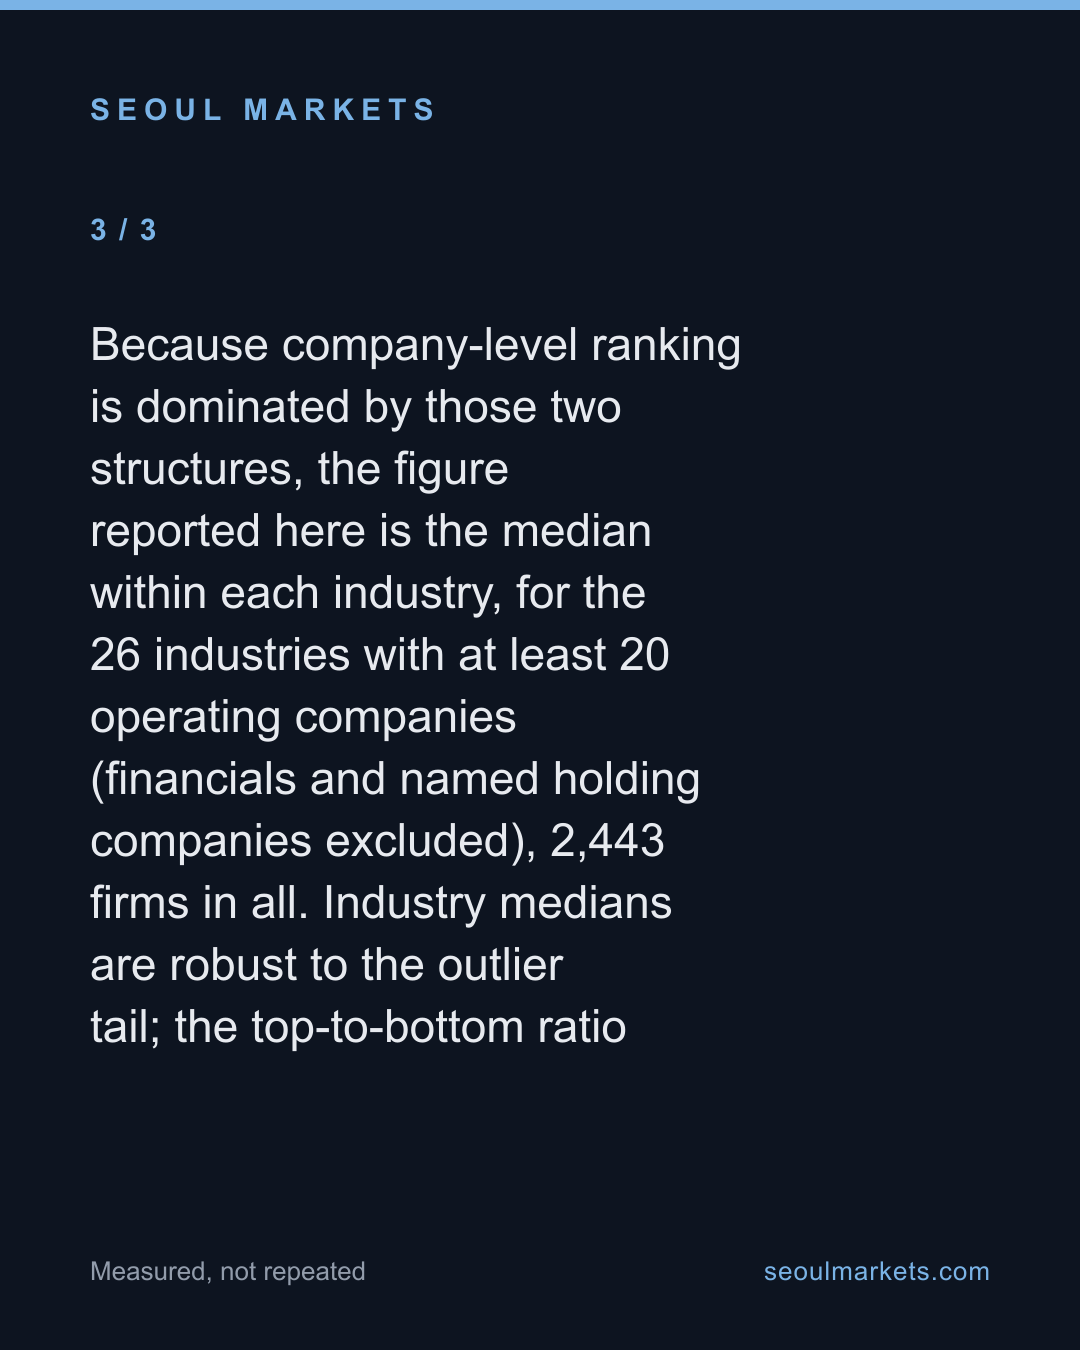
- Because company-level ranking is dominated by those two structures, the figure reported here is the median within each industry, for the 26 industries with at least 20 operating companies (financials and named holding companies excluded), 2,443 firms in all. Industry medians are robust to the outlier tail; the top-to-bottom ratio is 17.5x
- Excluded figures
- Any company-level ranking. Sorting individual firms by market cap per head produces a list of holding companies and clinical-stage biotech, which is an artifact of where employees are booked, not a fact about the firms. No company is named or ranked here
- The word 'productivity'. Market capitalisation is a forward bet by investors, not value created by staff. A high figure means a lot of market value sits on few people; it does not mean those people made more. Read as high does not mean better
- Assets, revenue and profit. This is market value against headcount only. A capital-light industry here can be highly profitable, and a capital-heavy one can lose money
- Holding companies and financial firms themselves, removed rather than ranked. Their structure is exactly what breaks the company-level number
The full dataset behind these figures — every listed company, every row — is available to license. SeoulMarkets data for licence →
Not investment advice. SMarkets publishes data journalism for general information only. Nothing here is investment advice, a recommendation, or an offer to buy or sell any security — any investment you make is at your own risk and responsibility. Figures are derived from official public data sources and may be revised by the issuing agency. Verify independently before acting.
Take this away — 5 cards
The figures in this article, as images. Free to repost with the address on them.