A Korean ETF above its stated value falls back tomorrow — unless it holds Asian stocks, in which case it rises
Across 605,072 fund-days, a premium on a domestic or US-tracking ETF predicts a 0.48-point underperformance tomorrow. On an Asia-tracking synthetic fund it predicts a 0.32-point gain. Same number, opposite meaning.
AI-assisted, human-reviewed sourcing. Figures are pulled programmatically from the official sources listed at the end of this article and checked by an editor before publication.
etfnet asset valuepremium discountsynthetic etfkorean funds
There is a piece of advice that circulates whenever retail investors discover exchange-traded funds: check the premium. If the fund trades above its net asset value, you are paying more than the holdings are worth, and you should wait.
Across every Korean ETF that traded between January 2024 and August 2026, that advice is correct — and then, for one group of funds, it inverts completely.
What a premium usually predicts
Take every fund-day where an ETF closed in the top 5% of its own historical premium range, and measure what that fund did the following day against its own average.
| Group | Fund-days | After a premium | After a discount |
|---|---|---|---|
| Domestic, physically replicated | 17,866 | −0.483pp | +0.397pp |
| US-tracking | 6,434 | −0.480pp | +0.474pp |
| Asia-tracking, physically replicated | 1,577 | −0.018pp | +0.165pp |
| Asia-tracking, synthetic | 632 | +0.318pp | −0.055pp |
The first two rows are what the textbook describes. A fund that closed expensive relative to its holdings gives back about half a point the next day; a fund that closed cheap gains about the same. The correction is symmetric, it is large relative to a daily move, and it rests on 24,300 observations.
The last row runs the other way. An Asia-tracking synthetic fund that closed at a premium went on to outperform by a third of a point. Buying it at what looked like the worst moment was, on average, better than buying it on a quiet day.
We should be plain about the sample: 632 fund-days is a twentieth of the domestic sample, and the Asian physical row sits between the two extremes rather than alongside the synthetic one. This is a strong pattern in a small group, not a law.
The obvious explanation is wrong
The intuitive reading is that Chinese markets are shut while Korea trades, so the published asset value is stale and the ETF price is simply ahead of it.
The US row rules that out. American markets are not merely shut during Korean hours — they are shut entirely, with no overlap at all. If a closed underlying market broke the relationship, US-tracking funds would be the most broken of the lot. Instead they revert at −0.480 and +0.474, indistinguishable from domestic funds.
Whatever separates the Asian funds, it is not the simple fact of a closed exchange. We do not know what it is. The feed publishes each fund’s net asset value but not when that value was struck or against which session, and we are not going to invent a mechanism we cannot see in the data.
How large the deviations get
The prediction result above is about direction. Size is a separate question, and it splits along two axes that turn out to be roughly additive.
| Average absolute deviation | Physical | Synthetic |
|---|---|---|
| Domestic underlying | 0.247% (667 funds) | 0.541% (27 funds) |
| Foreign underlying | 0.602% (376 funds) | 0.796% (84 funds) |
Being synthetic roughly doubles the typical gap. Holding foreign assets roughly doubles it again. Leverage, which is the feature that attracts the most warnings, adds the least: leveraged domestic funds average 0.390% against 0.289% for unleveraged ones, a difference of a tenth of a point.
At the extremes the range is wide enough to matter to anyone holding these funds:
| Fund | Average gap | Cheapest | Dearest |
|---|---|---|---|
| TIGER China Hang Seng Tech Leveraged (synthetic, H) | 2.95% | −31.9% | +18.2% |
| TIGER China EV Leveraged (synthetic) | 2.69% | −22.1% | +15.3% |
| KODEX China H Leveraged (H) | 2.19% | −25.0% | +14.6% |
| TIGER Japan Semiconductor FACTSET | 1.98% | −15.8% | +11.6% |
| TIGER US Nasdaq 100 | 0.43% | −6.1% | +3.4% |
| KODEX 200 | 0.16% | −0.8% | +3.5% |
| KODEX Money Market Active | 0.01% | −0.0% | +1.5% |
The gap between the top and bottom of that list is a factor of roughly 300. A Korean money-market ETF tracks its stated value to a hundredth of a percent. A leveraged synthetic China fund has closed as much as 31.9% below its stated value and 18.2% above it — a span of fifty points on the same instrument.
Across all 605,072 fund-days, the average absolute gap is 0.414%, and 9.79% of fund-days exceed a full percentage point.
What follows from this
Not a trading rule. We measured closing prices, and the differences here are smaller than the spreads and costs on exactly the funds where they are largest.
What does follow is narrower and more durable: the premium figure is not one measurement. On the 1,068 domestic and US funds in this data it behaves the way the textbooks say and reverts within a day. On 22 Asia-tracking synthetic funds it does not revert at all, and reading it the same way would have pointed the wrong direction for two and a half years.
Anyone quoting a single premium number for “Korean ETFs” is averaging together two populations that do not behave alike, and the smaller one is the one where the number is largest and most likely to be quoted.
Data & Verification Notes
- Data as of
- Sources
- Financial Services Commission (Korea) — Securities Product Price Information Open API — getETFPriceInfo (daily close and net asset value for every listed Korean ETF)
- Cross-checks
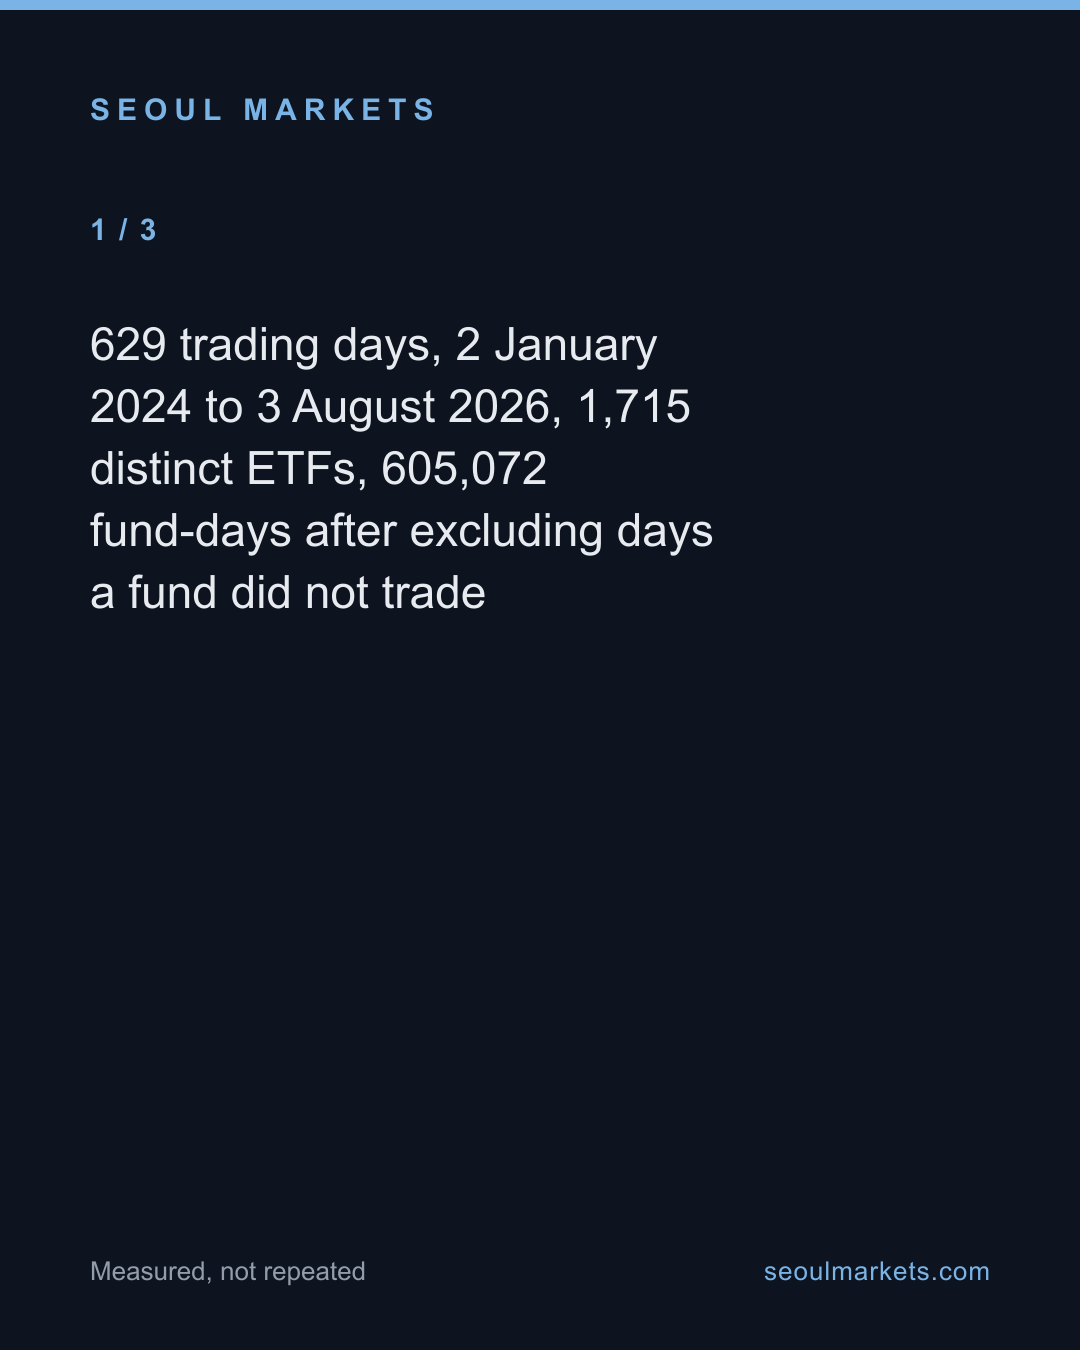
- 629 trading days, 2 January 2024 to 3 August 2026, 1,715 distinct ETFs, 605,072 fund-days after excluding days a fund did not trade
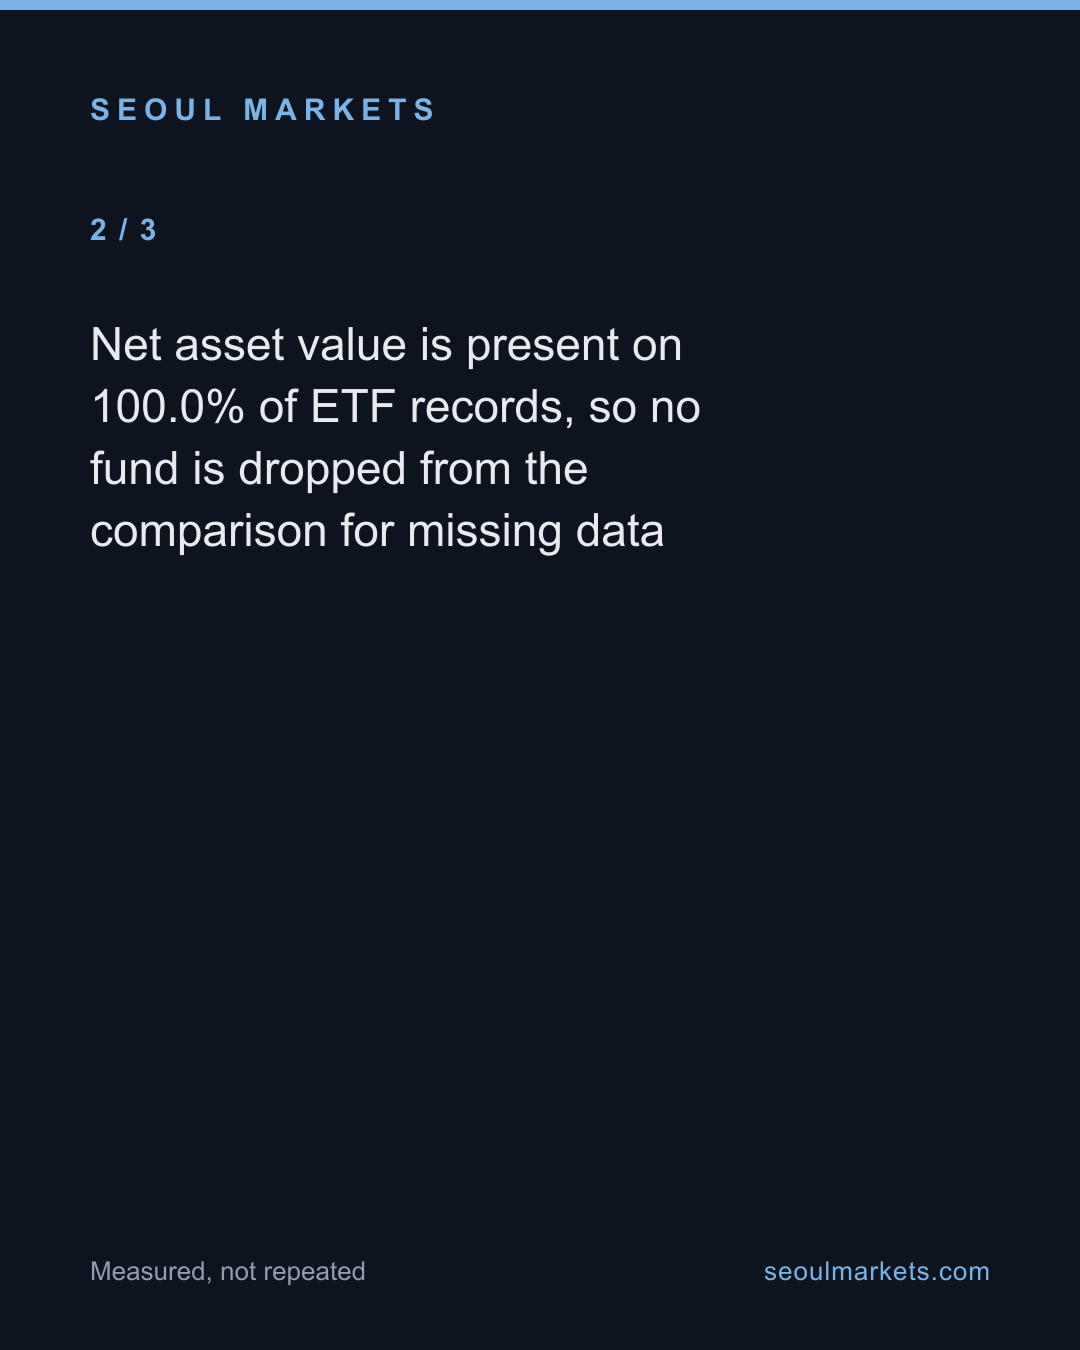
- Net asset value is present on 100.0% of ETF records, so no fund is dropped from the comparison for missing data
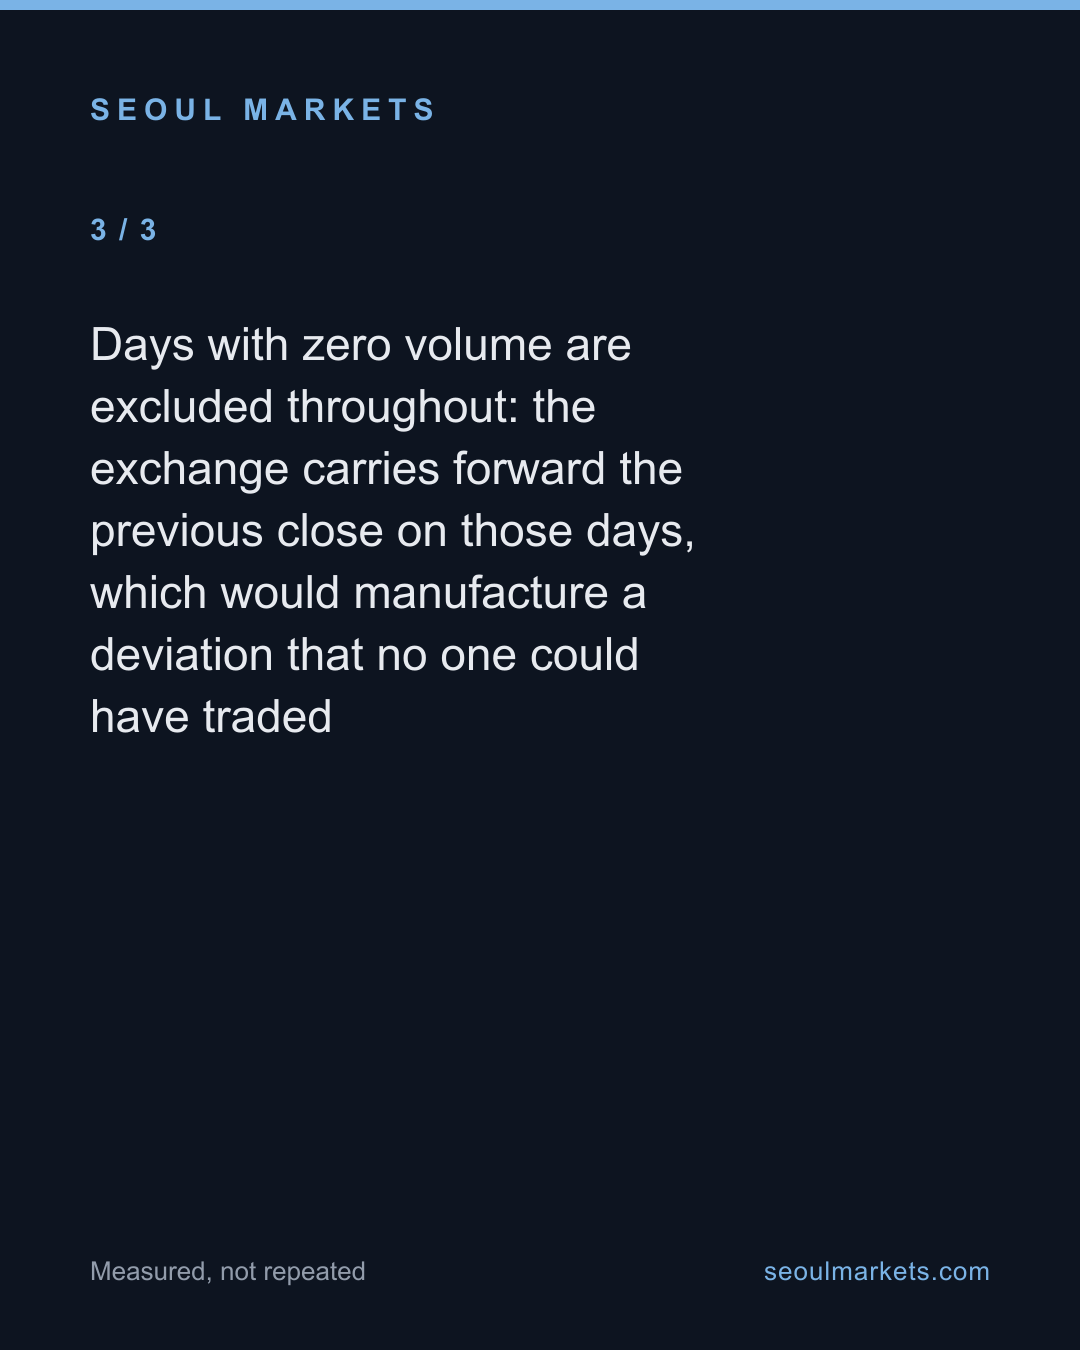
- Days with zero volume are excluded throughout: the exchange carries forward the previous close on those days, which would manufacture a deviation that no one could have traded
- Next-day returns are measured against each subgroup's own unconditional mean, not against zero. The two groups' baselines are 0.085% and 0.082% per day, so drift is not the explanation
- Leverage, replication method and underlying region were separated rather than assumed: leverage adds 0.10 points to average deviation, synthetic replication adds roughly 0.2 to 0.3, and Asian underlying adds roughly 0.3 to 0.4
- The US subgroup is the control that rules out 'the underlying market is closed' — US markets are shut throughout Korean trading hours and US-tracking ETFs revert as cleanly as domestic ones
- Fund-level averages are used for the deviation tables, so a single fund cannot dominate through trading frequency; only funds with 200 or more traded days are included
- Excluded figures
- When each fund's net asset value is struck, and against which session's close. The feed publishes the value, not its timestamp. Every mechanical explanation for the Asian result therefore stays out of this article
- Whether any of this is tradeable after costs. We measure closing prices; spreads, commissions and taxes are not in this dataset
- Individual investors' actual entry prices. We observe daily closes, not the intraday prints anyone paid
- Counterparty and collateral arrangements behind the synthetic funds, which are in prospectuses rather than in the price feed
- Anything before 2 January 2024, and any ETF listed outside Korea
The full dataset behind these figures — every listed company, every row — is available to license. SeoulMarkets data for licence →
Not investment advice. SMarkets publishes data journalism for general information only. Nothing here is investment advice, a recommendation, or an offer to buy or sell any security — any investment you make is at your own risk and responsibility. Figures are derived from official public data sources and may be revised by the issuing agency. Verify independently before acting.
Take this away — 5 cards
The figures in this article, as images. Free to repost with the address on them.